The January Numbers
Meaningful Eastside buying opportunities usually show up before a headline tells everyone what has changed. Public trend data from Redfin and Zillow helps confirm the broader pattern in hindsight, while broker-level Northwest MLS insight makes it possible to follow current listing behavior, pricing changes, inventory, and live market activity more closely.
Redmond opened 2026 with one of the more striking winter resets on the Eastside, following directly on the heels of Sammamish's 16.9% drop the month before. According to Redfin-sourced single-family data in the CVA Analytics Seattle dashboard, Redmond's median sale price fell from $1,780,000 in December 2025 to $1,389,995 in January 2026. That is a month-over-month drop of about 21.9%. Compared with January 2025, when the median sale price was $1,675,000, January 2026 was down about 17.0%. The long-run chart below uses public Redfin-sourced data for transparency and now includes the rebound that followed. That is exactly why winter dips matter in a city like Redmond: they can be brief.
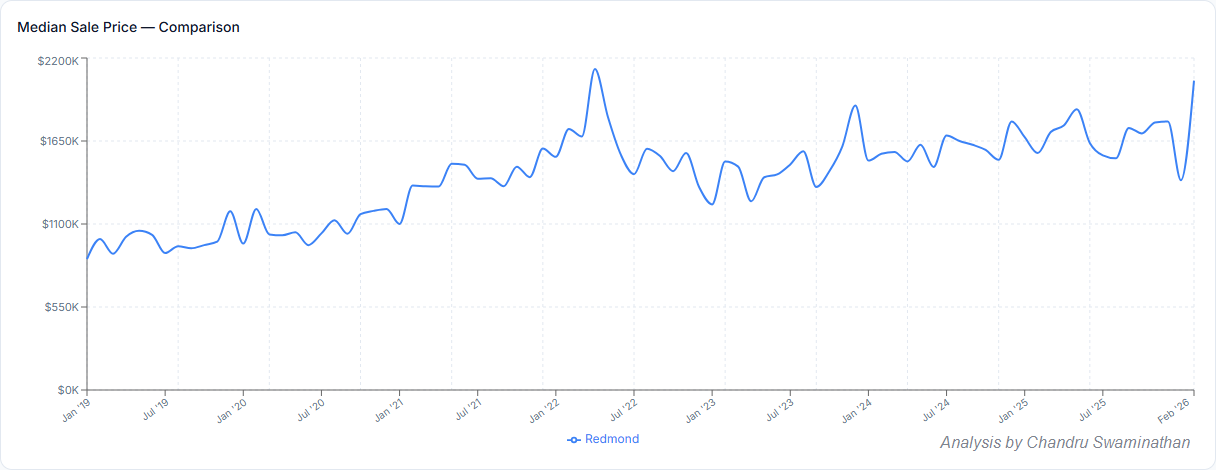 Redmond single-family median sale price from January 2019 through the latest available dashboard data. Source visualization: CVA Analytics dashboard using Redfin-sourced data.
Days on Market and Pace
As always, one monthly median should be read carefully. In a city like Redmond, the mix of homes sold can move the median sharply from month to month. But January's price drop was accompanied by a clear slowdown in market pace. Days on market jumped from 43 in December 2025 to 105 in January 2026. Months of supply also climbed from 0.8 to 2.1 over the same period, signaling a market that was giving buyers more time and more choice than they had at the end of 2025.
That broader setup matched outside reporting in February 2026. Windermere's February market update said the Eastside's median residential sold price fell 16% year over year to $1,435,000, while active listings climbed 49% from the prior January. Redfin's February 19 market release said the country was in the 'strongest buyer's market in recent history' and that buyers 'have the power to negotiate on price.' Redfin also reported that the typical home sold in January for 2.1% less than its final list price, while homes that went under contract spent 66 days on market, the slowest January pace in a decade.
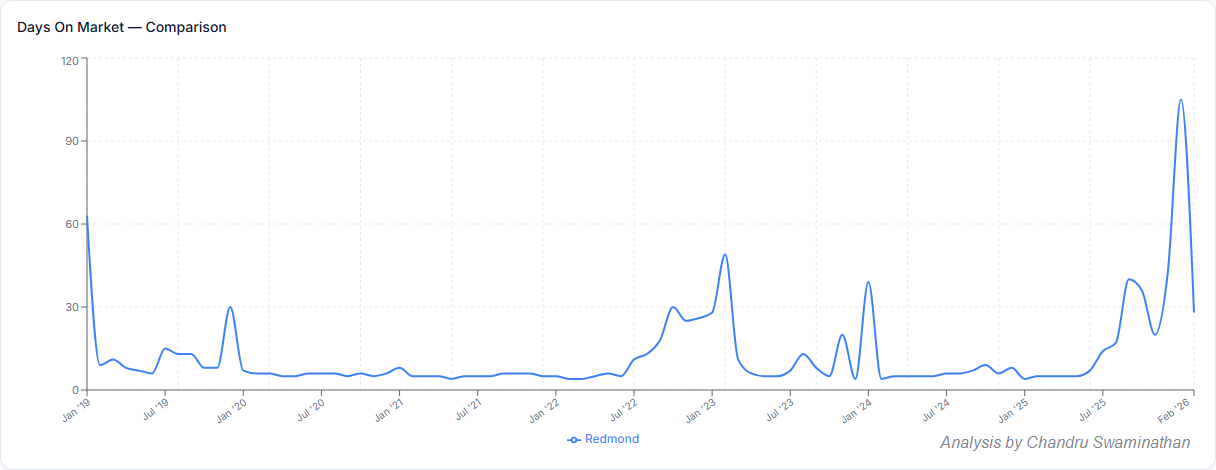 Redmond single-family days on market from January 2019 through the latest available dashboard data. Source visualization: CVA Analytics dashboard using Redfin-sourced data.
What This Means for Buyers
That does not mean Redmond suddenly became a weak market. In January 2026, the average sale-to-list ratio was still roughly 100.1%, which shows that well-positioned homes could still command strong offers. But the combination of lower median pricing, more inventory, higher months of supply, and dramatically longer market times points to a market that was materially less frenzied than it had been earlier in the cycle.
Looking Ahead
For buyers, this is why late winter can matter so much. When a market like Redmond cools, even temporarily, the best opportunity is often not a distressed property. It is the ability to buy a strong home with less emotional competition and more room to negotiate terms before the spring market regains momentum. The pattern continued into the next month: Mercer Island's February 2026 reset showed a similar 21.8% month-over-month drop, reinforcing that the winter window was an Eastside-wide phenomenon. And for buyers weighing whether to act now or wait for rates, the mortgage math behind purchase-price-vs-interest-rate is worth understanding before deciding.
This is where I bring value to Eastside buyers at CVA Realty Group. Public trend data helps confirm the story, but broker-level Northwest MLS insight is what identifies when leverage is improving and when buyers may have a brief opening before the wider market catches up.
Chandru Swaminathan is a real estate broker licensed with eXp Realty, serving buyers and sellers in Redmond, Sammamish, Bellevue, Kirkland, and across Seattle's Eastside.
Sources
CVA Analytics Seattle dashboard (Redmond single-family): https://seattle.cvarealtygroup.com/?area=seattle&city=Redmond&propertyType=single_family
Windermere W Report, February 2026 ("Eastside median residential −16% YoY to $1,435,000"): https://getthewreport.com/local-market-update/local-market-update-february-2026/
Redfin Housing Market News, February 19, 2026 ("strongest buyer's market in recent history"): https://www.redfin.com/news/
Opinions expressed are those of the author and do not necessarily reflect the views of eXp Realty.